Measuring Bioconductor: usage, publications, funding, and what they say about sustainability
A dashboard for Bioconductor's impact, built from public data, and what 17 years of download logs, a thousand linked papers and 668 NIH awards say about where the project stands.
In this post, I want to describe a site I built, impact.bioconductor.org, that pulls together Bioconductor’s release manifests, download logs, CITATION files, PubMed, iCite, and NIH RePORTER, and then walk through what the data say about the project’s impact and (more tentatively) its sustainability.
I get asked about Bioconductor “by the numbers” a few times a year, usually by someone writing a grant renewal or a program officer wondering what an award produced. Bioconductor is 24 years old and has 3,810 packages, and the usage numbers are large, but the evidence behind any such number has never been in one place. So the questions that matter for the project’s future (who carries the usage, what the papers and funders look like, whether growth is broad or concentrated) have mostly gone unanswered, or answered from memory.
I maintain the site and the definitions on it are documented and open to correction. The numbers below are from the 2026-10-07 snapshot. Most come with caveats, and the site shows those next to the numbers.
Where the data come from
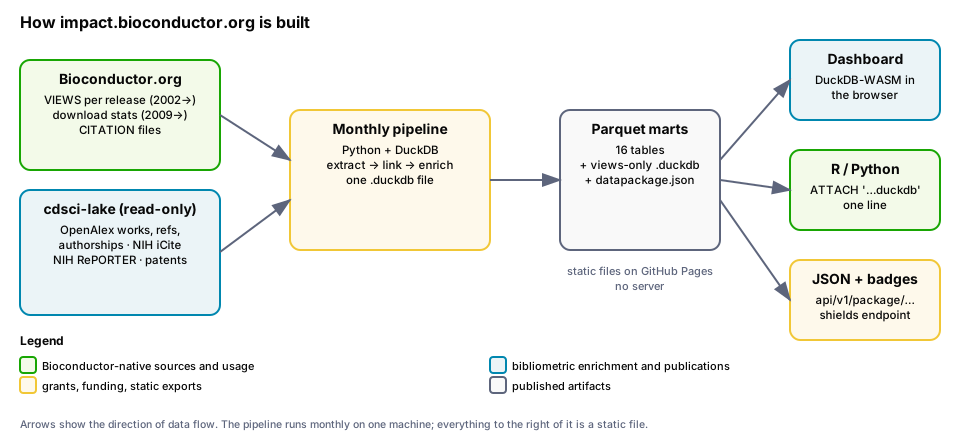
Everything is public. The package metadata come from the VIEWS files that bioconductor.org publishes for every release since 1.8 in 2006 (the release announcements page fills in package counts back to 1.0 in May 2002). Download statistics come from the monthly tables the project has published since January 2009, which report distinct IP addresses and raw downloads per package per month. Each package’s own CITATION file, read from the package source, says which paper the authors want cited. Those DOIs are joined to OpenAlex for citation counts, to NIH iCite for the Relative Citation Ratio, to NIH RePORTER for the grants a paper acknowledges, and to OpenAlex author affiliations for institutions and countries. Patent citations come from the Reliance on Science dataset.
The joining is done once a month by a little Python pipeline into a single DuckDB file. The site itself has no server. It’s a static page that loads a handful of Parquet files and runs SQL in the browser with DuckDB-WASM, so every chart is computed from the same tables you can download. Figure 1 shows the whole path.
The snapshot refreshes monthly, so the figures below will drift.
Growth
Bioconductor 1.0 shipped with 15 software packages. Release 3.23, in April 2026, has 2,418, plus 928 annotation packages, 436 experiment-data packages and 28 workflows, for 3,810 in all. The growth isn’t quite exponential any more, but it hasn’t flattened either: the software repository has added between 40 and 120 packages per release for the last decade, and the net count has never gone down between releases in that span. Thirty-six packages in the current release are marked deprecated.
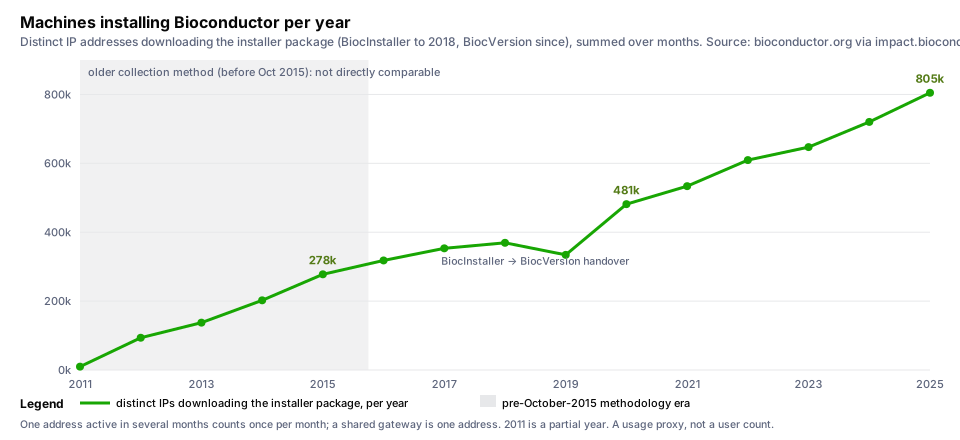
Usage grew faster than the package count. The honest way to count machines installing Bioconductor is the installer package, which every setup downloads: BiocInstaller until 2018 and BiocVersion since (the BiocManager package itself lives on CRAN). By that measure, 278,000 distinct IP addresses installed Bioconductor in 2015, 481,000 in 2020, and 805,000 in 2025. A caveat applies. The collection method changed in October 2015, so the series before and after are not strictly comparable, and the site draws a shaded band at that boundary rather than a continuous line (Figure 2). A distinct IP per month is also a proxy, not a user (a university NAT gateway is one address, and a laptop on three networks is three). I use it because it is the least gameable of the numbers the project publishes.
Note that I am not summing distinct IPs across packages. One address that installs fifty packages would count fifty times in such a sum, which makes it a measure of volume, not of people. The first version of this post did exactly that, and I have corrected it.
Usage is concentrated. Of the 2,418 software packages, 68 account for half of the summed per-package distinct IPs in the last twelve months, and 1,472 account for 90 percent. The top of that list is infrastructure that everything else imports: BiocVersion, BiocGenerics, S4Vectors, IRanges, Biobase. That is fine for a package that thirty labs need, but it does mean that any headline usage number for the project is mostly a statement about a few dozen packages, and that the project’s sustainability depends on a small number of maintainers of infrastructure that everyone else builds on. The site lets you exclude the infrastructure tier to see the rest, and the dependency data now in it make those packages visible.
Publications
952 packages (a quarter of the total, and about 37 percent of software packages) point at a paper through a DOI in their CITATION file or DESCRIPTION. Those resolve to 1,167 distinct papers. Together the papers have been cited about 664,000 times according to OpenAlex. The median Relative Citation Ratio across the 838 papers that iCite scores is 1.84, where 1.0 is the NIH average for a paper of that age and field, and 260 of them sit in the top decile of NIH-funded papers. 212 of the papers are cited by at least one patent.
A quarter sounds low, and it is lower than the real publication rate, for a reason that took me a while to figure out. A CITATION file reflects what the authors want cited now. When edgeR’s authors published the v4 paper in 2025, the file was updated to point at it, and the 2010 Bioinformatics paper that most of the field cites disappeared from view. Because bioconductor.org keeps the rendered citation page for every past release, the pipeline now reads all of them and keeps the union. That single change took edgeR from one linked paper to five and added 167 papers across 143 packages. Packages that never shipped a DOI are still invisible to this method, and that is on purpose. I tried matching package names against paper titles. It produced about 1,500 matches, most of them wrong, because muscle, gage, and tuberculosis are also English words. I spent quite a bit of time looking at those before giving up on the idea.
Some packages ask you to cite the method or the data rather than the software. The muscle package cites Edgar’s 2004 alignment paper, and the two AlphaMissense annotation packages cite the DeepMind paper in Science. That is the right thing for those packages to do, and the site reports it as written, but it means a leaderboard sorted by citation ratio puts a wrapper package next to a landmark paper. The site now defaults to the authors’ own DOI and CITATION links, marks papers shared by several packages, and lets you opt in to the lower-confidence links found in package descriptions.
Funding and geography
The 1,167 papers acknowledge 668 NIH awards across 26 Institutes and Centers. Note that these are the grants that funded the paper a package asks you to cite, not the grants whose research used the package. The second number is much larger, and it’s the one a funder usually wants. Computing it needs the citing papers, which means scanning OpenAlex’s 1.3 billion reference edges. That scan finished as I was writing this: 365,166 distinct papers cite at least one of the papers a Bioconductor package asks you to cite, 842 packages have at least one citing paper, and DESeq2’s paper alone is cited by about 90,000. Joining those citing papers back to RePORTER, to count the NIH-funded research that used Bioconductor, is the next step.
The papers come from all over. Using the senior author’s affiliation for the 1,067 papers where OpenAlex has one, 399 are from the United States, 116 from Germany, 98 from the United Kingdom, 85 from Australia, 54 from Switzerland and 42 from Spain. Walter and Eliza Hall, EMBL, and the European Bioinformatics Institute sit alongside Johns Hopkins, Harvard, and Fred Hutch in the top institutions. Since more than half of these papers come from outside the US, much of the funding behind them is invisible to RePORTER. The Authors@R field in a package DESCRIPTION can declare funders, and 136 packages do, which is a start.
People
Parsing Authors@R without evaluating it gives 4,786 distinct people credited across the packages, 1,171 of them with an ORCID. The identity is the ORCID when there is one and a normalized name otherwise, so homonyms may merge and name variants may split. The site says so on the page. 596 packages list a shared project mailbox as maintainer, which is worth knowing when counting “maintainers” as people. That also means about a sixth of the ecosystem is maintained by the core team rather than by the people who wrote it.
Using the data yourself
Here, I think, is the useful part. Because the site is a set of Parquet files on a static host, the dashboard is one of three ways to read the data, and the other two do not need a browser.
If you use DuckDB in R or Python, one line attaches a views-only database over the published files, with a definition on every column:
ATTACH 'https://impact.bioconductor.org/data/bioc-intelligence.duckdb' AS bi (READ_ONLY);
SELECT * FROM bi.package_impact WHERE package_name = 'limma';
The same from R:
library(duckdb)
con <- dbConnect(duckdb())
dbExecute(con, "INSTALL httpfs; LOAD httpfs")
dbExecute(con, "ATTACH 'https://impact.bioconductor.org/data/bioc-intelligence.duckdb' AS bi (READ_ONLY)")
dbGetQuery(con, "SELECT * FROM bi.package_pubs_confident WHERE package_name = 'edgeR'")
Note the package_pubs_confident view. The database encodes the methodology choices as views, so the default you get is the one the dashboard uses, and the raw tables are there if you disagree. For people who don’t want SQL there is a JSON file per package at api/v1/package/<name>.json and a shields.io badge endpoint, so a README can show its own usage or citation count. The Data page lists all of it with a column dictionary.
What it doesn’t do yet
The citing-literature side is still thin. The reference scan now gives citing-paper counts per package and per grant, but the site does not yet break them down by year or join them to the funders of the citing work. Full-text mentions of package names in methods sections, which would recover usage from papers that never cite anything, are a larger job still. I have the corpus and a plan for judging name collisions, and nothing running yet. Download numbers are a proxy with a known seam in 2015. And the pipeline depends on package authors shipping a DOI: if your package has a paper and the site does not show it, the fix is a line in inst/CITATION, and there is a correction form on the About page for everything else.
So the picture is of installs that have grown faster than the package count for 15 years, resting on a few dozen infrastructure packages and a core team that maintains a sixth of everything. Who maintains those packages, and who pays for it?
The code is at github.com/seandavi/bioc-intelligence. I want to thank the people who have published Bioconductor’s download statistics and release manifests in machine-readable form for seventeen years, and to OpenAlex, NIH iCite, and RePORTER for making the enrichment possible without a single API key. If you have a question about Bioconductor that the site should answer and doesn’t, I’d like to hear it.